The main benefit of Diffraction Imaging (DI) is that you image subsurface discontinuities (ridges, faults, truncations etc) in the data at a much higher resolution than what you get in "normal" reflection data. DI also extends the detectability of small scale, sub-wavelength features. If you have already processed your data to PSDM, much of the cost is involved in the velocity model building. It is a relatively small step to create a DI volume. By doing this you get high resolution results at low cost. Since the diffraction response is always present in the data, an uplift will always be provided, adding value to the investment in acquisition and the PSDM velocity model.
We offer a unique workflow that is model based, leverages the physics of Fresnel zone sampling, is customized to the client interpretation objectives and validated by modelling.

Customization to Interpretation (CTI)
Our customization of the DI product to interpretation objectives begins with the reconnaissance on the legacy PSDM and extends through every phase of the project. Advanced features of OpendTect such as structural filtering, Thinned Fault Likelihood, Basement Fracture Likelihood, the Thalweg tracker, and Machine Learning are applied as a measure of the improvement in resolution and detectability at various stages in the project.
Structural Diffraction Imaging
Faults, fractures, injectites, volcanics, karst and angular unconformities are examples of discontinuities that produce a diffraction response. In the figure on the left, a PSDM depth slice is animated with two consecutive DI depth slices. In the DI, we progressively suppress the reflectivity to bring out the fine detail of the fault system. Here we see an example of Fresnel zone sampling of the continuum between reflectivity and diffractivity. This continuum, where sub-specular reflection is progressively attenuated, provides a unique advantage for resolution and detectability.
Stratigraphic Diffraction Imaging
Stratigraphic features such as pinchouts, channel edges, and stringer sands have a diffraction response. The example on the right shows the DI response of three channel complexes, animated between PSDM and DI. Channel edges produce edge diffracted waves that tune with each other as the channel narrows. In this way very narrow channel features are imaged, and it is possible to decompose a channel complex into elementary channels.
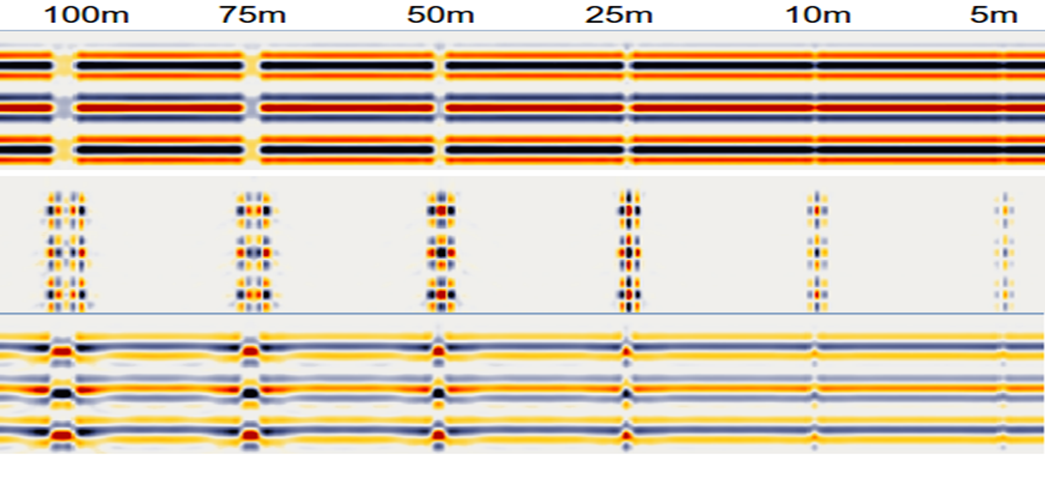
Validation by diffraction modelling
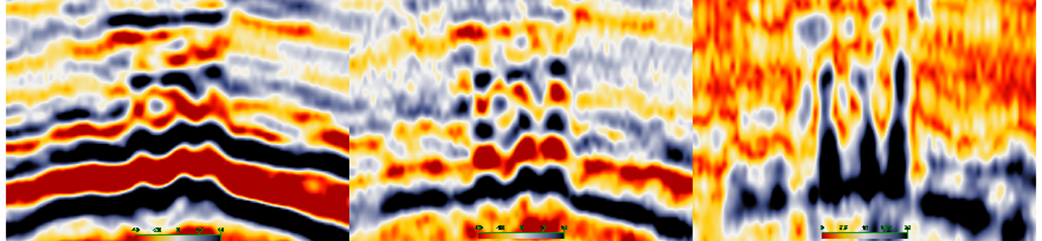
For diffraction imaging, the fundamental geological building block is the edge diffraction associated with a halfplane. We can use this building block to model the DI response and better understand the response on the real data. In the figure on the left, fluid escape pipes are modelled by placing gaps in reflectors. The top panel of the modelling figure shows the PSDM, the middle panel the pure diffraction response. Here we can observe the tuning response, for example, at a 50m diameter pipe, where the imaged diffraction events from either side of the pipe interfere constructively. The third panel shows the response for the partial attenuation of reflectivity. A real data example is shown in the bottom figure, with the PSDM on the left, and the DI in the center. Here we can see a clear uplift of the DI, with a good character match to the conceptual modelling. The rightmost figure is the instantaneous amplitude of the DI, clearly indicating the fluid escape pipe geometry.